Understanding how your income is taxed and how the tax brackets work will aid your tax planning and make for more informed, reasonable discussions of tax policy. Now, with inflation back in the normalish range, let's take a look at the new tax brackets and see how best you can plan for the new year.
Here's what to know as 2025 fades away and a new year is set to begin.
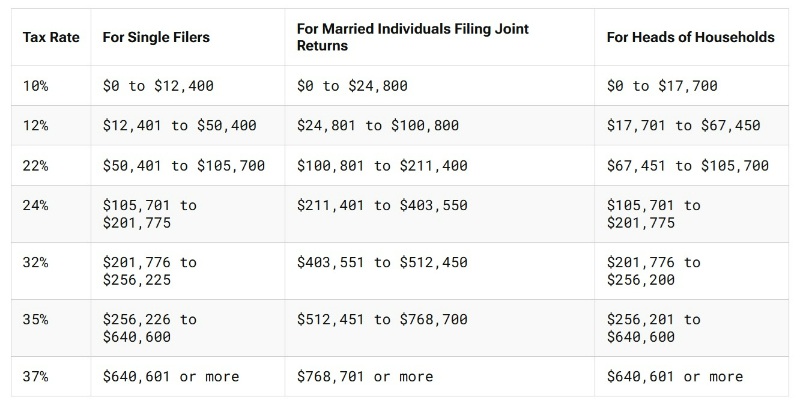
Tax Brackets for 2026
For context, here are the tax brackets for 2025, via the IRS and Tax Foundation, for taxes that will be due in April 2026.
Here's how the tax brackets will change for Tax Year 2026, via the IRS, which will be due in April 2027.
The standard deduction has also been raised for 2026, even after the mid-year adjustment that the One Big Beautiful Bill Act provided in 2025. Here's what the standard deduction pre-OBBBA was in 2025:
- Single: $15,000
- Married Filing Jointly: $30,000
- Head of Household: $23,500
Here's what it was for 2025 after the OBBBA passed:
- Single: $15,750
- Married Filing Jointly: $31,500
- Head of Household: $23,625
And here's what the standard deduction will be for 2026 (to be utilized in April 2027):
- Single: $16,100
- Married Filing Jointly: $32,200
- Head of Household: $24,150
From 2022 to 2023, there was a big increase in the standard deduction, thanks to inflation. For the past three years, though, the increases were more modest, similar to how much the 2026 retirement contribution limits increased.
People Don't Understand How Tax Brackets Work
One of the most interesting phenomena I've noticed over the years is that most people don't actually understand how tax brackets work, and they routinely overestimate how much they pay in taxes. For example, I put up a few Twitter polls a couple of years ago discussing tax brackets. Take a look:

Keep in mind, these are not opinion questions.
These questions actually have correct answers that can be easily calculated and, frankly, given how far apart the answers are from each other, pretty easily estimated. It's like asking, “Is China closer to Vietnam, Switzerland, Cuba, or Tonga?” Yet only 27%-30% of people got the answers right. Sheer random chance would allow 25% of them to get it right. But what is more interesting is that 61%-73% of respondents OVERestimated the tax burden.
Why People Don't Get Tax Brackets
There are a few reasons why people can't answer those questions correctly. I think I know why.
#1 People Don't Understand the Difference Between Marginal Tax Rates and Effective Tax Rates
If you don't the difference between marginal and effective tax rates, keep reading. Remember that your marginal tax rate, or tax bracket, is the rate at which your next dollar earned will be taxed. Your effective tax rate is the total tax paid divided by your total income. Your effective tax rate is always less than your marginal tax rate. Perhaps this is best illustrated by demonstrating how to come up with the right answer to the question.
If a married couple earns $100,000 in 2025 (for taxes that will be paid in April 2026) and takes no deductions besides the standard deduction, how much will they pay in federal income tax?
First, they subtract out the standard deduction of $31,500. That leaves $68,500. The first $23,850 is taxed at 10%, generating $2,385 in tax. That leaves $68,500 – $23,850 = $44,650. That $44,650 all falls within the 12% tax bracket, and so it is all taxed at 12%. $44,650 x 12% = $5,358. $2,385 + $5,358 = $7,743. $7,743/$100,000 = 7.74%.
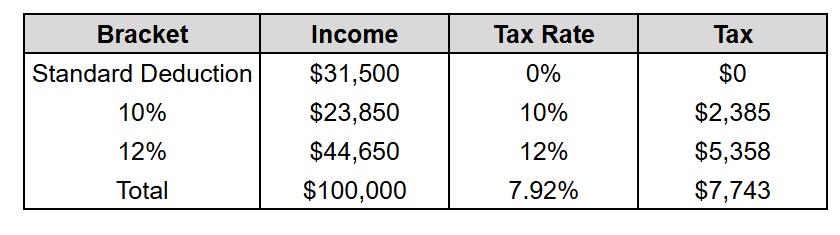 There are two key points here. The first is that there is a 0% bracket. Some of your income is not taxed at all. That might be the standard deduction. It might be itemized deductions. There might be some above-the-line deductions. Whatever. But anything you get a deduction for isn't taxed at all. It's in the “0% bracket.” Some critics on Twitter started listing all these other deductions that could be taken. However, all of those would have LOWERED the tax due. This is, in essence, the MAXIMUM tax paid on that income, not the minimum. So, most people still overestimated the tax due, even though I used the maximum tax possible in this situation.
The second is simply that being in the 12% bracket does not mean you pay 12% in taxes. You only pay taxes on the money in that bracket. You fill the brackets as you go. Otherwise, you would have paid $12,000 in taxes instead of $7,743. If you knew someone making $100,000 was in the 12% bracket, you should know that the answer to the question MUST be less than 12%. There is no reason whatsoever to guess a number higher than that.
More information here:
You Should Do Your Own Taxes at Least Once – Here’s How I Do Mine
#2 People Don't Understand the Difference Between Taxes Withheld and Taxes Paid
Most people are employees. They don't actually calculate how much tax they owe, and they don't send it to the IRS each quarter like business owners do. It is just pulled out of their paycheck by their employer before they get it. The newer withholding tables are more accurate than the older ones, but most employees still have more withheld than they actually owe. That's why they get these huge tax refunds every spring. That is another phenomenon I find interesting—just how bizarrely happy people are to loan money interest-free to their government. But I think it contributes to the idea that people think they pay a lot more in taxes than they do.
#3 People Don't Know What Federal Income Tax Is
There are also a lot of people who don't know the difference between all of the taxes we pay. Don't get me wrong: there are a lot of taxes. There are state and local income taxes. There are payroll taxes like Social Security tax, Medicare tax, one of the two types of Patient Protection and Affordable Care Act (PPACA) taxes, and unemployment tax. There are sales taxes and property taxes and gas taxes and inheritance taxes and estate taxes. I guess it should be no surprise that people cannot tell them apart. Several of these are also withheld from their paychecks (the state and local income taxes and payroll taxes like Social Security taxes, Medicare taxes, and one of the two PPACA taxes). In fact, some of those payroll taxes (and the other PPACA tax) even show up on their federal income tax return, further confusing the situation.
Most people DO pay significantly more than 7.74% of a $100,000 income in taxes but not in federal income taxes. The federal income tax is quite progressive (44% of people pay no federal income tax at all, while others have marginal tax rates as high as 37%). However, there are other taxes that are not progressive. My state income tax in Utah is a flat tax, at least once you get past the deductions. Medicare tax is a flat tax—2.9% on all wage income, half from the employer and half from the employee. Social Security tax is also flat—12.4% on all wage income, half from the employer and half from the employee (but only up to an income of $176,100 in 2025 and $184,500 in 2026). After that, it goes to 0% (at least for the employee), thus becoming a regressive tax at upper incomes.
At any rate, people may not realize that the federal tax brackets only apply to federal income tax.
More information here:
20 Ways to Lower Your Taxable Income for High Earners
3 Big Tax Deductions for Doctors
#4 People Think Everything Taken Out of Their Paycheck Is Tax
Even worse, some people just assume everything taken out of their paycheck before they get it is a tax—including their retirement account contributions, their share of any life or health insurance premiums, or even court-ordered child support. Sorry, some of those are good things to pay, but they're not taxes, much less federal income taxes.
It's important to understand how our taxes work, especially the largest one for most of us—the federal income tax. Knowing how they work will help you to better manage your own finances and to actually have intelligent discussions with others about government and tax policies.
What do you think? Why do you suppose most people couldn't answer the questions above correctly? Why is the tax code so mysterious to US citizens?
[This updated post was originally published in 2020.]